What Moved the Market
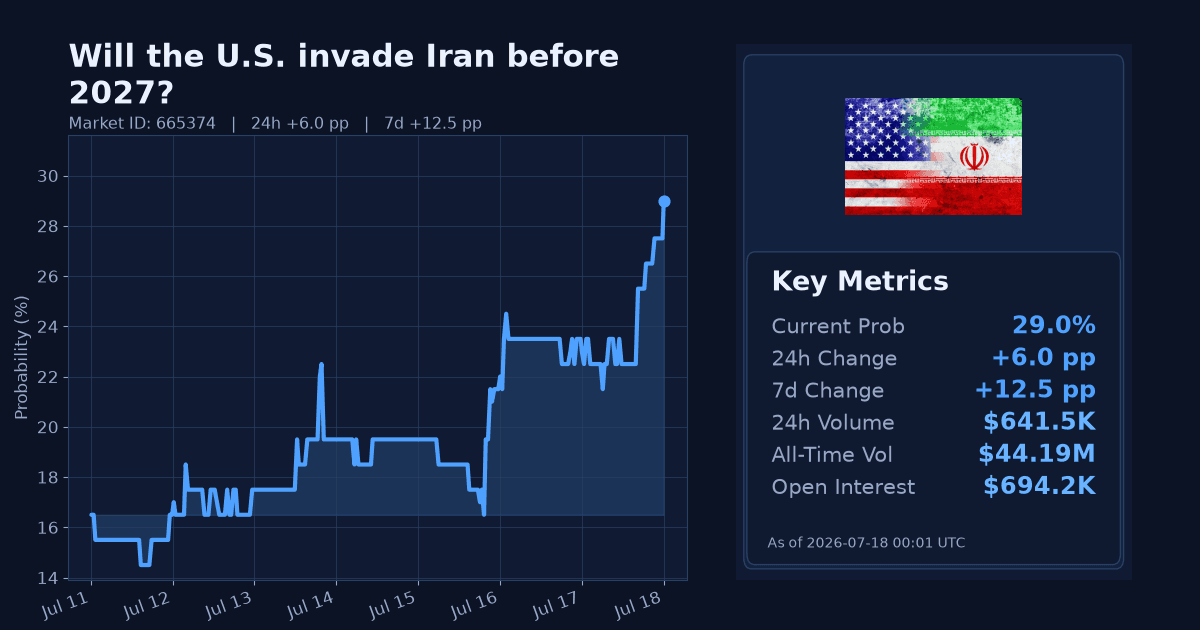
The Polymarket contract “Will the U.S. invade Iran before 2027?” rose sharply, climbing 6 percentage points over 24 hours to 29%. Over the past week it is up 12.5 points. The 24-hour move is flagged as “extreme” relative to recent trading.
The market resolves “Yes” only if the United States commences a military offensive intended to establish control over any portion of Iran by December 31, 2026, 11:59 PM ET. The contract window runs from November 5, 2025 through December 31, 2026.
Why It Likely Moved
- Repricing appears driven by reports on July 17 of U.S. strikes that destroyed bridges and damaged infrastructure at or near a key Iranian port, widening the campaign and raising escalation risk, according to AP News.
- Markets reacted to reciprocal action the same day, with Tehran targeting U.S. bases in the Gulf, signaling a broader confrontation tied to control of the Strait of Hormuz, per NPR.
- The move is further contextualized by an official July 13 statement that U.S. Central Command completed “another wave of strikes against Iran,” hitting dozens of targets with precision munitions, as the U.S. Central Command reported.
- Energy and risk proxies point to elevated conflict risk: WTI crude is $81.77/bbl and up 14.5% over 7 days, while the VIX is 18.77 and up 24.9% over 7 days, indicating higher perceived tail risks in the same window.
- Traders may also be incorporating signals around shipping resilience, with U.S. oil firms signing agreements with Iraq on alternative crude shipping routes on July 17, which AP News framed as export and energy security measures.
How Strong the Move Is
The 24-hour shift (+6pp) registers an extreme z-score of 24.0, indicating an outsized, atypical repricing relative to recent volatility. The 7-day change (+12.5pp) also scores as “extreme” (z ≈ 7.12), reinforcing a sharp upward repricing rather than routine noise.
Given simultaneous extremes in both 24-hour and 7-day measures, this looks like a volatility spike linked to new conflict headlines and official strike confirmations, not a gradual trend continuation.
Cross-Market Confirmation
- “Kharg Island no longer under Iranian control by August 31?” rose to 10.5% (+4.45pp 24h; +7.45pp 7d), aligning with heightened perceived risks to Iranian-held strategic assets.
- “Kharg Island no longer under Iranian control by July 31?” moved to 4.0% (+1.05pp 24h; +2.7pp 7d), a smaller but directionally confirming uptick.
- “Will the Iranian regime fall before 2027?” is at 10.0% (+2.0pp 24h; +3.0pp 7d), a modest rise that is directionally consistent with broader escalation pricing.
Collectively, related markets show upward 24h and 7d deltas, providing confirmation rather than divergence.
News & Real-World Context
- On July 17, U.S. strikes hit bridges and collapsed a tower at or near a key Iranian port as Washington expanded its campaign, raising concerns about disruption around the Strait of Hormuz, per AP News. The same day, Tehran targeted U.S. bases in the Gulf, escalating the confrontation, according to NPR. Broader shipping and legal risks tied to the Strait were also highlighted by NPR on July 17.
- Prior to these developments, the U.S. Central Command stated on July 13 that it had completed another wave of precision strikes against Iran, indicating an ongoing operational tempo.
- Separately, U.S. oil firms signed July 17 agreements with Iraq to develop alternative crude shipping routes, which AP News described as efforts to expand export options and bolster energy security.
Bottom Line
Traders marked up the probability of a U.S. invasion of Iran within the Nov 2025–Dec 2026 window after back-to-back reports of U.S. strikes inside Iran and Iranian retaliation, reinforced by a recent CENTCOM strike announcement. The move is extreme by recent standards but still prices invasion as a sub-1-in-3 outcome, reflecting elevated but not base-case expectations. Absent further official signals, this looks like an escalation-driven repricing rather than a structural conviction shift.
Market Conditions at Time of Writing
- Current Probability (%): 29.0
- 24h Change (pp): +6.0
- 7d Change (pp): +12.5
- Volume (24h, $): 641,475.55
- Open Interest ($): 694,162.87
- Spread (pp): 1.0
- Z-score (24h): 24.0