What Moved the Market
-
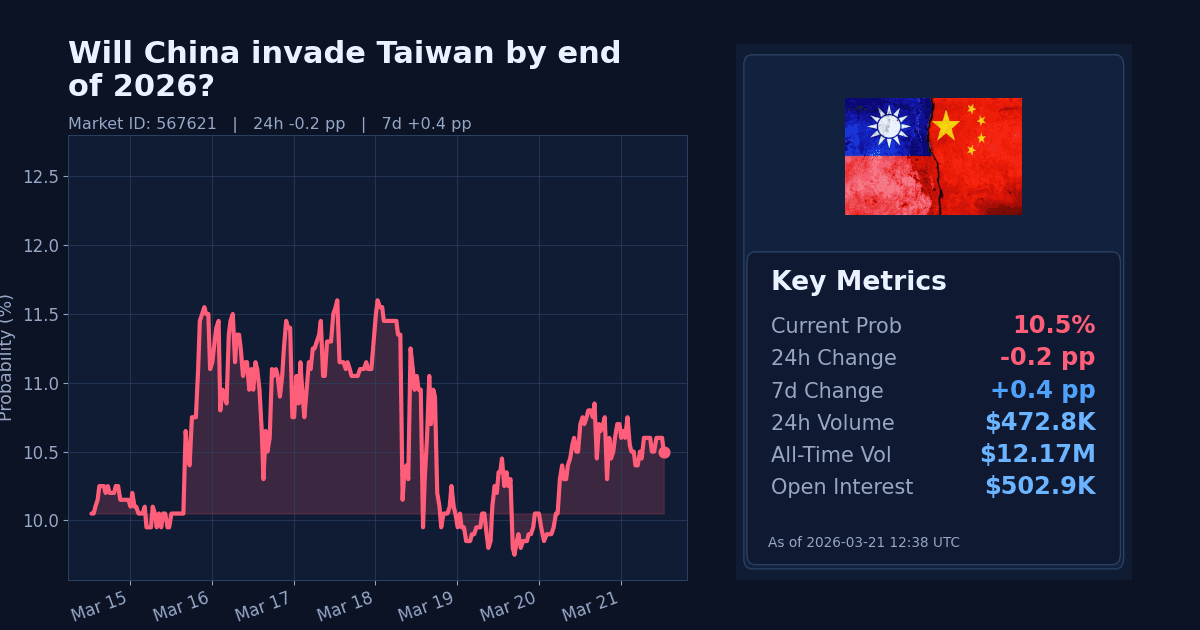
The Polymarket contract on whether China will invade Taiwan by December 31, 2026, 11:59 PM ET, edged down 0.2 percentage points over the past 24 hours to 10.5%. The market covers the window from July 24, 2025 through the end of 2026.
-
Trading conditions were active but orderly, with a tight 0.2pp spread, $472,798 in 24h volume, and $502,931 in open interest. Over the last 7 days, the contract is up a net 0.45pp.
Why It Likely Moved
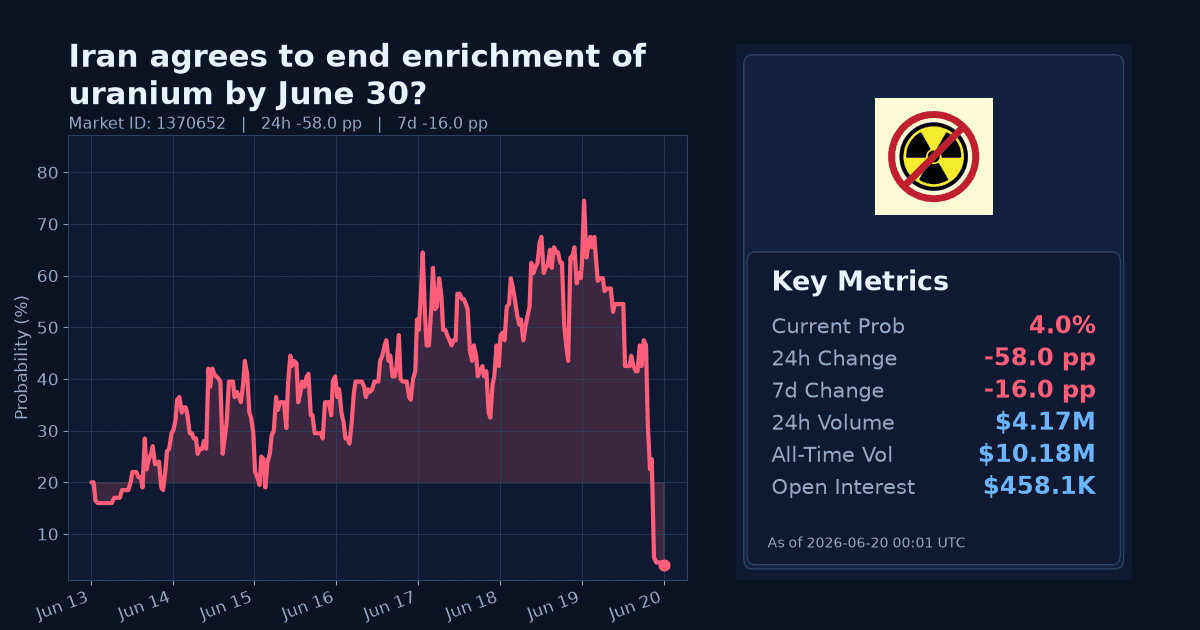
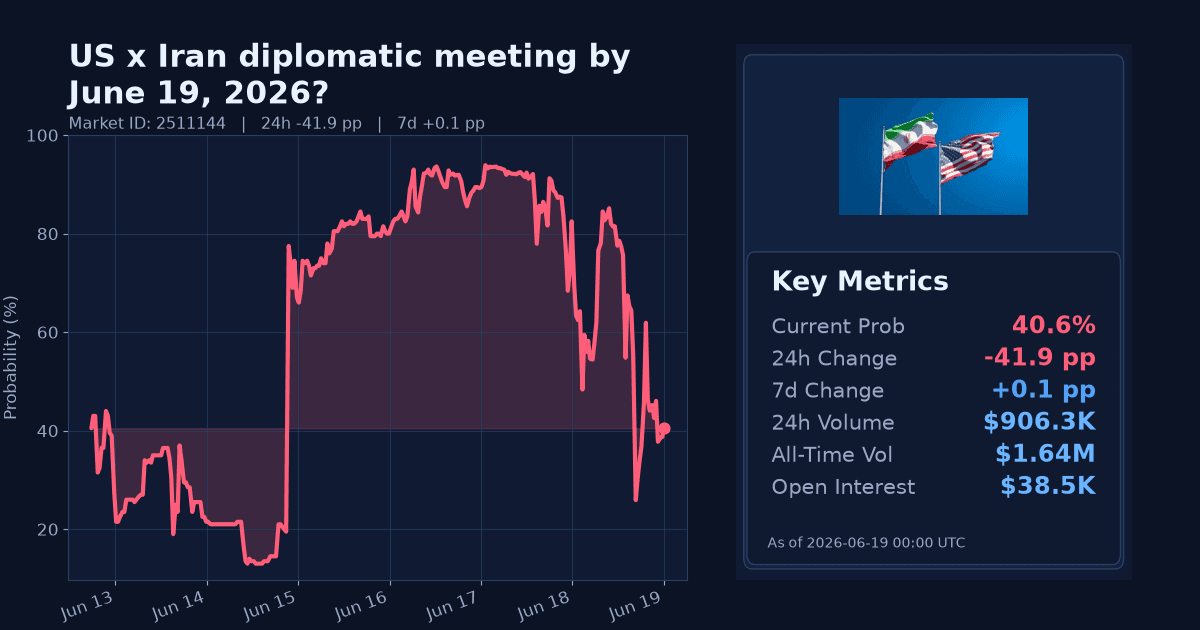
- The small downtick appears driven by markets reacting to an ongoing shift in geopolitical focus toward the Iran war, with no new Taiwan-specific signals in the news flow provided.
- Repricing follows related markets that are concentrated on Middle East scenarios, suggesting near-term conflict risk is being priced more heavily there than in East Asia.
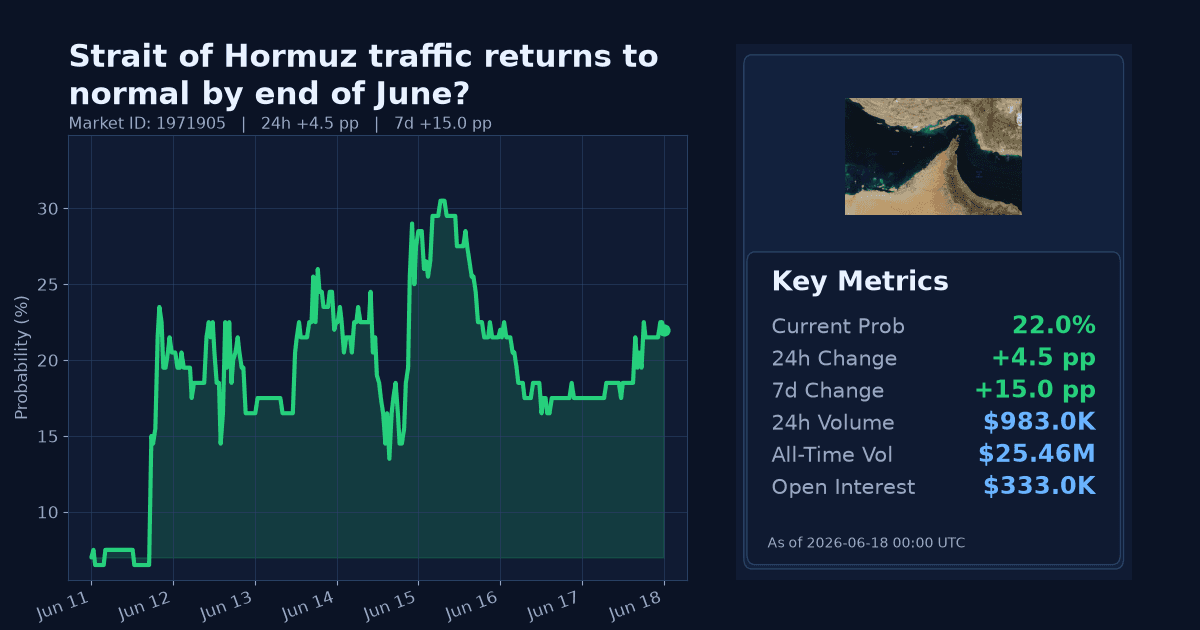
- Macro context shows Brent crude at $106.41/bbl with a 48% rise over 30 days, which appears tied to energy and shipping stress around the Middle East rather than Taiwan contingencies.
- The move also appears consistent with a softer safe-haven tone over the past week (gold down ~9.5% 7d), which can marginally weigh on tail-risk pricing without a discrete Taiwan catalyst.
How Strong the Move Is
-
The 24h change (-0.2pp) registers as a normal move for this market per the 24h z-score (0.4). That points to routine day-to-day repositioning rather than a shock.
-
Over 7 days, the net change is a modest +0.45pp. The 7d z-score is characterized as elevated but not extreme, indicating above-average, yet contained, week-on-week repricing within a still low absolute probability.
Cross-Market Confirmation
- US forces enter Iran by March 31? at 25% (high 24h volume) suggests conflict risk is being priced in the Iran theater rather than East Asia, a divergence from the Taiwan market’s slight downtick.
- Kharg Island no longer under Iranian control by March 31? at 13% likewise concentrates risk on Iran-linked maritime dynamics, not Taiwan, reinforcing the divergence.
- The Iranian regime falls by March 31? at 1.6% indicates low odds of regime change despite active conflict pricing, offering no confirmation of broader global conflict spillover toward Taiwan.
News & Real-World Context
- News flow centers on the Iran war entering its fourth week, with indications the U.S. is considering “winding down” military efforts while regional deployments continue. This narrative concentrates geopolitical attention on the Middle East rather than the Taiwan Strait.
- Reports highlight sustained shipping disruptions tied to the Strait of Hormuz and potential knock-on effects for energy and global food supply. In markets, Brent crude’s 30-day gain (~48%) underscores these pressures, while gold’s 7-day pullback and a slightly softer US Dollar Index over the week point to a mixed risk backdrop rather than a fresh escalation signal for East Asia.
Bottom Line
- The latest move is small and looks like short-term noise within a low baseline probability. With no Taiwan-specific headlines in the provided context, the contract’s slight downtick aligns with risk being priced more heavily in the Iran theater.
- Absent new, direct catalysts tied to the Taiwan Strait, this appears short-term rather than structural.
Market Conditions at Time of Writing
- Current Probability (%): 10.5
- 24h Change (pp): -0.2
- 7d Change (pp): 0.45
- Volume (24h, $): 472,797.74
- Open Interest ($): 502,931.14
- Spread (pp): 0.2
- Z-score (24h): 0.4